tech.africa: African tech news and analysis since 2004



Latest
All news →
Google picks 10 African studios for $1 million games fund

VoxNexus releases offline voice AI for Android phones

Seychelles Cabinet backs AI strategy and sovereign cloud

Visa and Senegal sign two-year digital payments MoU

GTBank cards and Squad checkout go live with Google Pay

Cassava becomes authorised reseller of Anthropic’s Claude

Akuna, Google opens free AI filmmaking programme in Africa
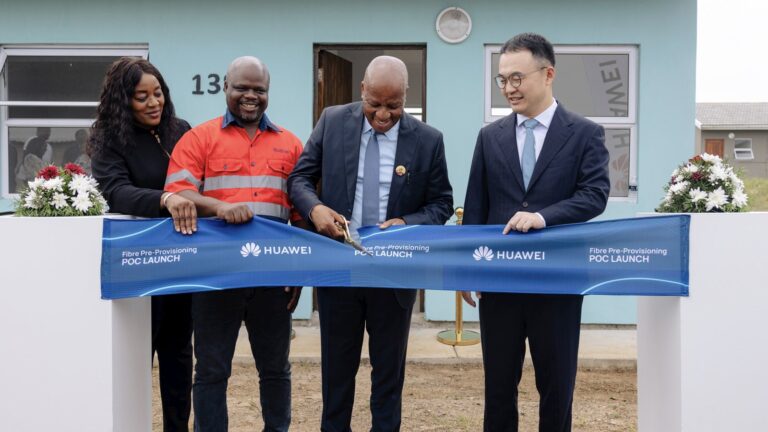
KwaZulu-Natal pilot makes 405 new homes fibre-ready
Benin, Ghana and Rwanda link national ID systems in pilot
Somalia’s parliament passes Digital Transactions Bill

Vodacom and UJ extend AI partnership with student hackathon
Madagascar reforms could add 1.1 million users, GSMA says
Pillar guides
Canonical references, refreshed quarterlyGuide
Starlink in Africa: countries, prices and speeds (2026)
GuideThe cheapest way to send money to Nigeria from the UK
GuideDStv: packages, prices, and channels in Africa (2026)
GuideDStv Streaming: Prices, Packages, Streama Decoder
GuideOpenView: free satellite TV channels, frequency settings, and decoder prices in South Africa
GuideMulti TV frequency, channels list, and setup guide (2026)
GuideNilesat 201: frequency settings, channels, and free TV guide (2026)
GuideRain packages, prices, and coverage in South Africa (2026)
From around Africa
Browse by country →

















Most read
Still being read
- MTN wins all the 3 GHz 5G spectrum Ghana put on offer7 Oct 2026
- Cloud Hosting in Nigeria: what to check before you choose29 Sep 2026
- 906 million Africans have coverage and do not use it23 Sep 2026
- The grid build behind South Africa's data centre boom7 Sep 2026
- PAPSS volumes up 1,000%, average payment down 80%15 Sep 2026
- Vodacom tests a dual-band Massive MIMO antenna with Nokia1 Oct 2026
- 400 NVIDIA GPUs to power a South African AI cloud1 Sep 2026
- Malawi has 87% 4G coverage and 12.5% internet use26 Aug 2026
- AFC raises CHF 350m in first African digital bond16 Aug 2026
- Memory prices push Africa's $30 smartphone out of reach26 Sep 2026
Evergreen favourites
- DStv free channels: how to watch without a subscription (2026)
- Showmax packages and prices in 2026: your complete guide to streaming in Africa
- DStv Now: Free Live TV Channels & Catch Up Content
- WhatsApp to stop working on old generation phones by the end of December
- How to watch SABC channels for free
- Cool Ideas fibre packages, prices, and review (2026)
- Starlink competitors and alternatives in 2026
- How Aero Contractors offers very low airfares. The catches!
- WhatsApp now allows account linking on multiple phones
- iPhone 12 in 2026: specs, prices, and where to buy in South Africa
Upcoming events
See all events- 16-19 November 2026:Africa Tech Festival 2026 opens CTICC registration – Cape Town International Convention Centre
Africa Internet Compass · live data
The African internet, in numbers
Latest data ingest 12 Nov 2026 · 20:15 UTC
3,003
African networks tracked
54
countries mapped
338k
IP prefixes mapped
72
Internet exchanges
202
data centres
174
MANRS-compliant networks
49
RIPE Atlas anchors
366
measurement probes
Built from AFRINIC · ARIN · RIPE NCC · APNIC stats · MANRS · RouteViews · Cloudflare Radar · MaxMind GeoLite2 · OONI · APNIC Labs · RIPE Atlas mesh
Where the African internet stands today
composite weighted across 10 measured signalsConnectivity composite
Bandwidth · latency · IPv6 capability · DNSSEC validation · clean traffic · network density · prefix count · intra-Africa mesh latency. 50 countries scored.
- 1South Africa15.8 Mbps · 869 networks · 9ms intra-Africa+2.12
- 2Tunisia10.9 Mbps · 30 networks · 29% IPv6 capable+0.90
- 3Senegal6.5 Mbps · 23 networks · 35% IPv6 capable+0.64
- 4Zimbabwe8.0 Mbps · 34 networks · 26% IPv6 capable+0.64
- 5Kenya5.7 Mbps · 299 networks · 18% IPv6 capable+0.63
Africa at a glance
Median across 54 countries, last 7 days.
4.7%
IPv6 capability
Range 1.3% – 12.7%
5.4 Mbps
Bandwidth (p50)
ZA leads at 15.8 Mbps
56%
Mobile share of traffic
vs 44% desktop
24%
HTTP/3 adoption
measured on Cloudflare edge
Intra-Africa connectivity, observed
RIPE Atlas anchoring mesh, 7-day windowFastest pairs
Where intra-African links live up to the geography.
- ZAMZ10 ms9 hops
- TGNG13 ms5 hops
- LSZA14 ms12 hops
Slowest pairs
Where paths likely traverse Europe and add round-trip penalty.
- TDTZ450 ms15 hops
- TDMU437 ms18 hops
- TDZA409 ms13 hops
Routing efficiency by country
measured round trip vs straight-line distance How much further a country’s traffic to the rest of Africa travels than the direct distance would allow, from RIPE Atlas measurements. Lower is better. 32 countries had enough measurement coverage to score.
- 1Zimbabwe94 ms median round trip to other African countries+64 ms
- 2Malawi75 ms median round trip to other African countries+69 ms
- 3Zambia90 ms median round trip to other African countries+73 ms
- 4South Africa130 ms median round trip to other African countries+81 ms
- 5Namibia137 ms median round trip to other African countries+99 ms
Where our measurement is thinnest
honesty over coverage-pride38
African countries have zero RIPE Atlas anchor
10
countries with no active measurement probe
7
countries tracked via fewer than 10 networks